
By Adam Gruber
Chicago company Cyclistic has worked to develop a bicycle network across the city. A user can rent a bike from one location and return it to any location. People can rent a bike for short trips or the whole day. The bike network also allows you to rent either electric or classic bikes. Cities across the USA are trying to encourage the use of public transport, but there are many challenges with giving the public access to bikes. Users can leave them at any station or even outside the network. There are also two types of users: casual and members. Members can pay for a monthly pass or purchase a one-day pass.
In some places, people may take one type of transportation, such as a bike, and then take the bus back home. This creates the main issue for the company. Making sure bicycles are at the main places people wish to use them. Many locations may become dumping grounds for bicycles. Some cities ban rentals because they become a public nuisance as dozens pile up at the most popular locations. Electric ones require even more consideration since they need to be recharged. There needs to be enough recharging stations in order to accommodate the potential number of bikes that will be left there.
There are 692 bike stations in the network. To analyze the data, I took a subset that used only the seven most popular start and end locations for January. I took trips between those seven places. I then took a random sample of bike trips to build the social network graph. There were 100 trips in the sample. Visually the graph would be incomprehensible and not highlight the key issues. Some of the locations in the data set almost exclusively have the same start and end location, such as one at the University Ave intersection. This makes sense since many users likely take their rented bikes out for the day and return near their home locations.
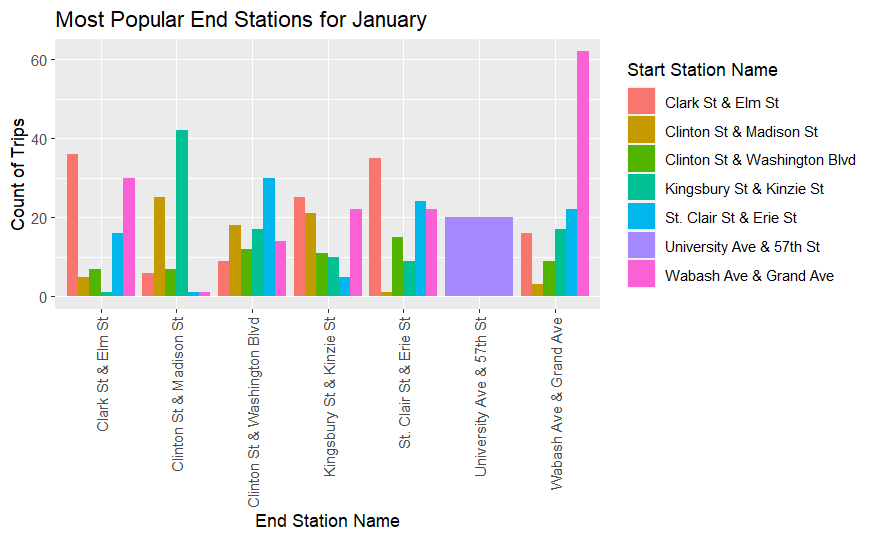
This histogram shows the most popular start and end locations but some have very few bikes get returned to the original start location. Kingsbury St. was the most popular start location in the data set but not the most popular in the network of my seven locations. That was Wabash Ave, and it was the most popular start and end location. This is from users traveling from less popular locations to Kingsbury St and then back. Wabash is most popular within the sample from users repeatedly starting and ending at Wabash Ave.
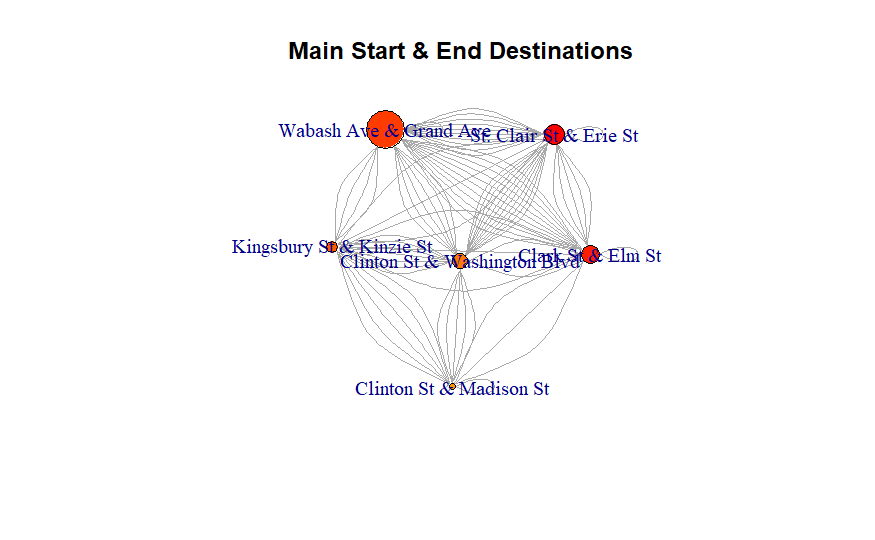
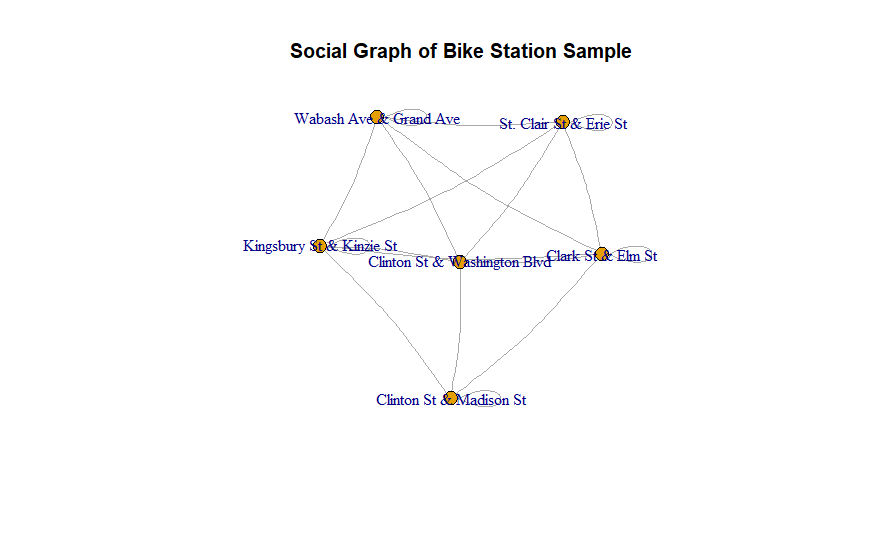
The social graph visually shows the main hubs in the trip sample. Wabash Avenue was one of the main hubs for people. The size of the node shows the number of connections in the network. Wabash Avenue is clearly the most popular start and end location in the subset of data. University Avenue was not connected with the rest of the network in the subset.
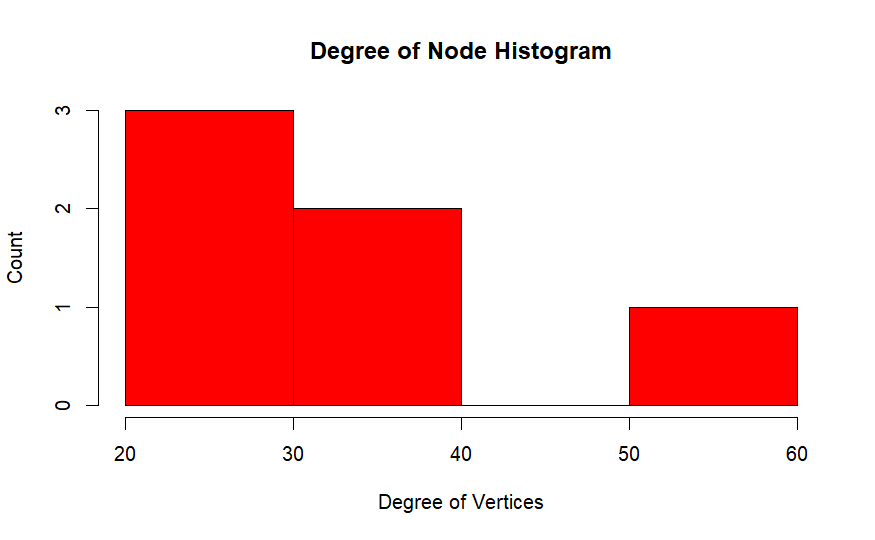
The histogram of node degrees shows off the connections in the sample. One node, Wabash Ave, had over half the connections in the network. Clair St and Clark St had the second most connections.
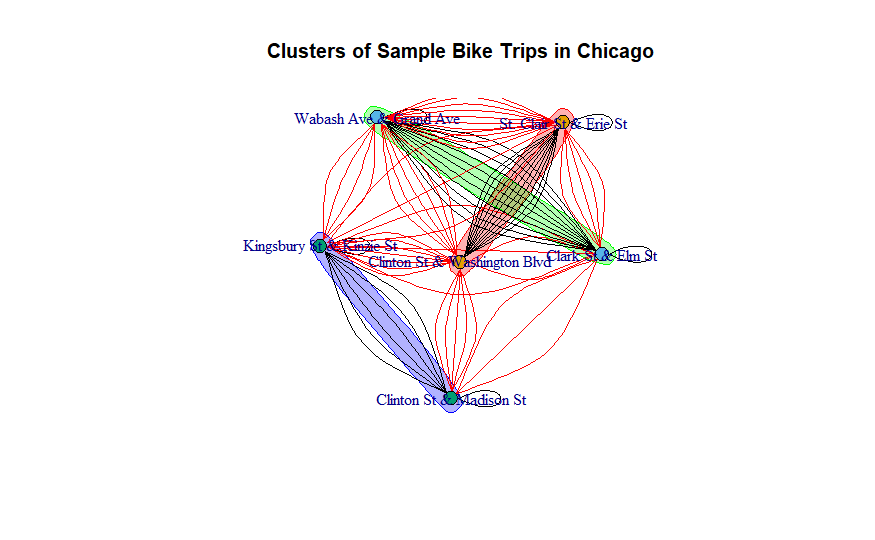
Louvain Cluster analysis was used on the total data set, and it showed that there were 34 clusters. Some clusters were very connected, while there were 15 clusters that had just a single node. Those would be similar to the University Avenue location, with the majority of trips starting and ending at the same point. The largest cluster had 123 nodes in it. This would be the most well-connected part of the city. The area where users are most likely to move the bikes without the assistance of the company redistributing bikes. The overall network had a modularity rate of 50%. The higher the score, the greater the number of connections throughout the total network. Currently, the overall network has many bikes on the fringes that might not cycle into the greater network where the larger populace is. This is something for the Cyclistic company to consider if low-connected nodes cost the same to build and maintain but bring less revenue.
Since certain destinations are more popular and connected than others, it is important to graph the classic bikes and see what destinations they are taken to vs. electric bikes. The black lines are trips within the cluster networks, and the red lines are trips outside the cluster network. Arrows curving back to the node are trips that started and ended at the same location.
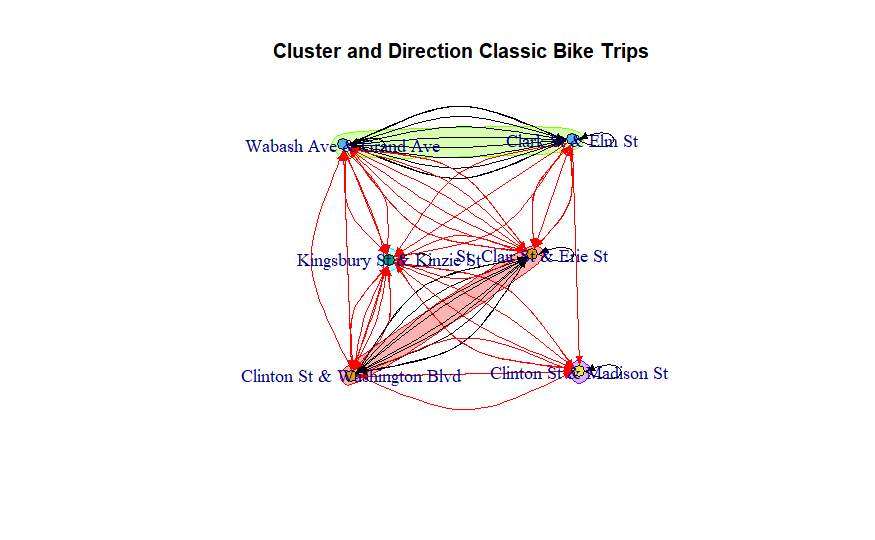
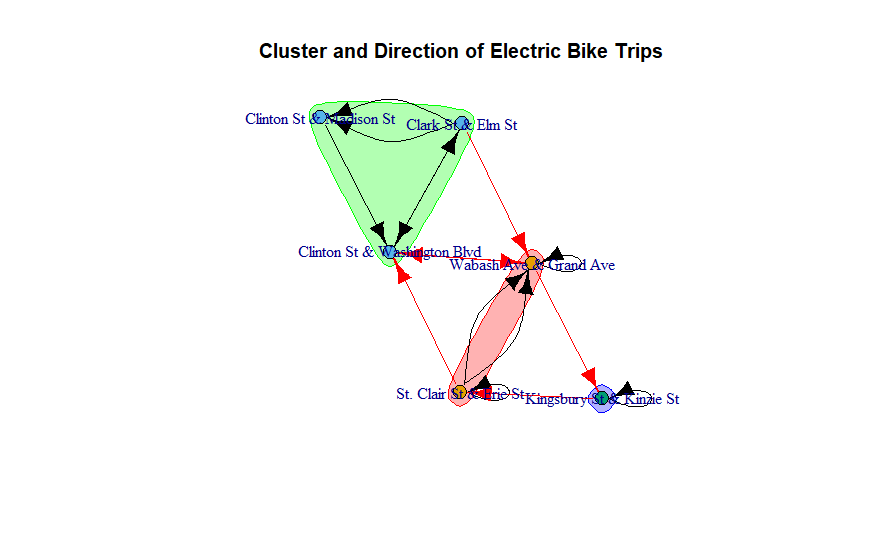
Electric bikes make up just 30% of the overall data set. Even in the most popular destinations, they make up about the same percentage. Kingsbury St has its own cluster for both classic and electric bikes. Wabash Ave is one of the most popular destinations for both classic and electric bikes. It appears that the destination will require extra bikes to be added there from other locations since it’s one most popular start but not end destinations. The company, Cyclistic, also needs to consider having extra charging stations at the Wabash Ave location. Our sample shows four trips coming into Wabash Ave and only one leaving.
The Electric Bike map clusters differ based on the number of connections between certain nodes. Both intersections with Clinton St are in the same cluster. This may come from customers needing to stop and charge the bikes on their trips or customers preferring the bikes for local shopping trips that may involve carrying more packages. Further research would need to be conducted on the trips of customers and why they prefer one mode of transportation over another.
Summary
Cyclistic has built a network of bicycles across Chicago. The company relies on consumers to check out the bikes and return them to the network to be reused. The network has natural ebbs and flows between many connections. Some outliers in the network have almost no connections. Some locations have users almost exclusively start and end in the same location. Kingsbury St is the most popular start and end location in the total data set, but most of its connections do not go exclusively to the most popular intersections. They are connected to a very diversified group. Some locations like University Ave rely heavily on users starting and ending at the same location. Some locations, like Wabash Ave, will require extra management by the company to manually reallocate the bikes from other intersections to prevent bike deficit. This is key to having bikes when and where customers desire them. The company needs to earn customers’ trust and move them away from other forms of public transport like cabs and ride-sharing. The company may need to manually move additional bikes during holidays, festivals, and sporting events. Many people may choose to bike to the festivals but feel a taxi might be safer to take home after the event.
Proper bicycle allocation also prevents issues with the city and potential legal action due to bikes littering certain areas. Rental bikes reduce the car traffic on roads as well as road maintenance. They can position themselves as beneficial to the city. Cyclistic can have a bright future ahead as long as it keeps the main stakeholders in mind.
Data Source
Palumbo, M. (2023). Cleaned, Analyzed, and Visualized: Cyclistic, A Bike Sharing Program. Kaggle. https://www.kaggle.com/datasets/michaelppalumbo/cleaned-analyzed-and-visualized-bike-sharing/data

Leave a comment