

Predicting what brings tourists to your country is essential when trying build your tourism industry. Its even more important when your most precious resources are limited and increasing tourism not only decreases the value of natural beauty.
Introduction
Accurately predicting what the high spending visitors desire most can allow the correct infrastructure to be built. It can increase revenue while decreasing the number of visitors to your nation.
This project focuses on predicting overall tourist spending based on their amenities and number of people in the party. This is from Tanzania and data come from a Kaggle competition. The main model was created using a Neural Network in R. This was tested using cross validation to test the level of accuracy on a new data set. There were 18,506 observations in the data set.
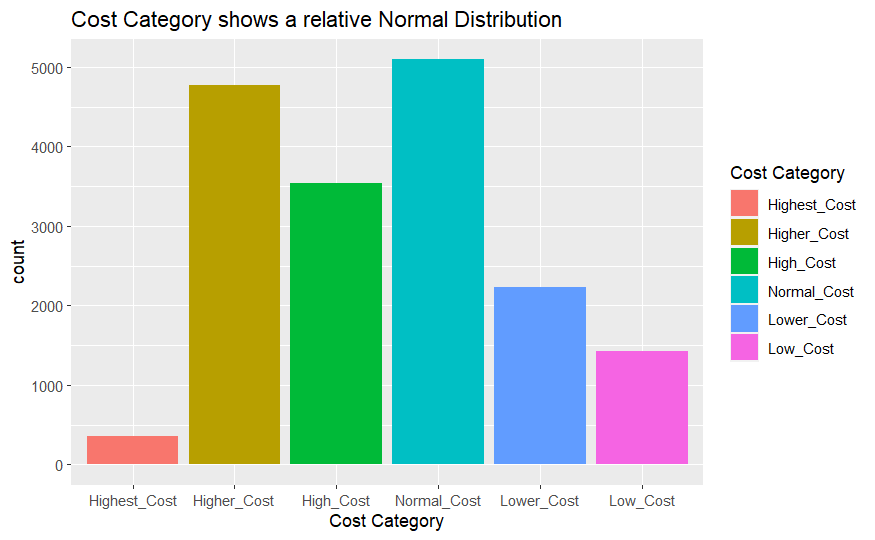
There was some exploratory data analysis to determine some of the main factors for cost categories.
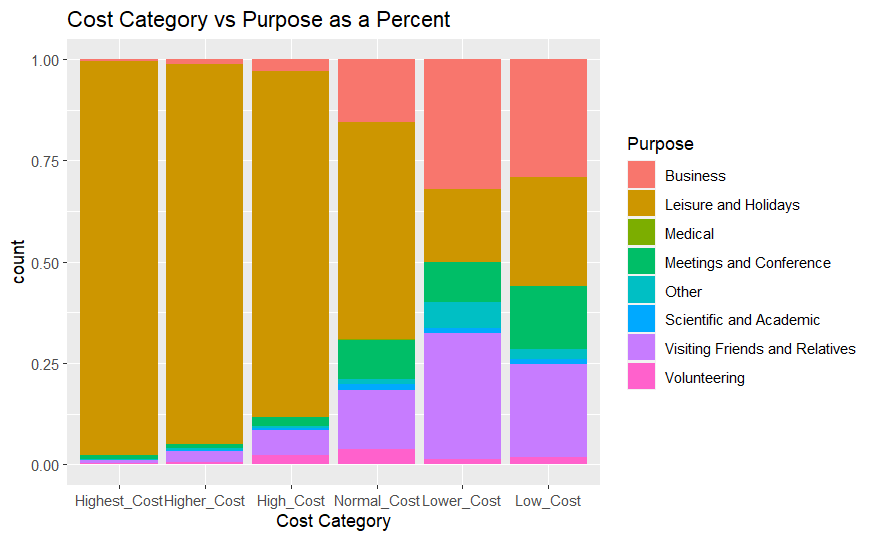
Most tourists are traveling for leisure, especially those in higher spending categories.
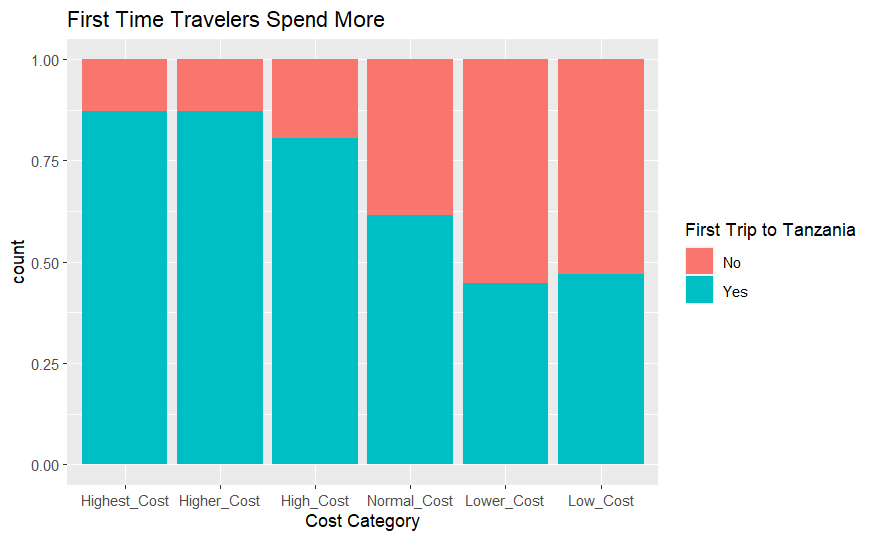
First time travelers spend more than repeat travelers. Repeat travelers could also be traveling for business or for volunteering purpose.
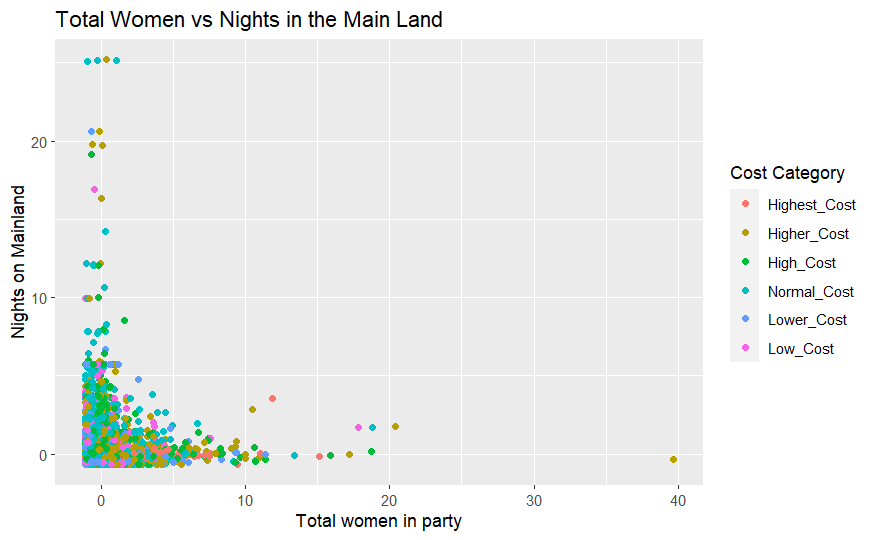
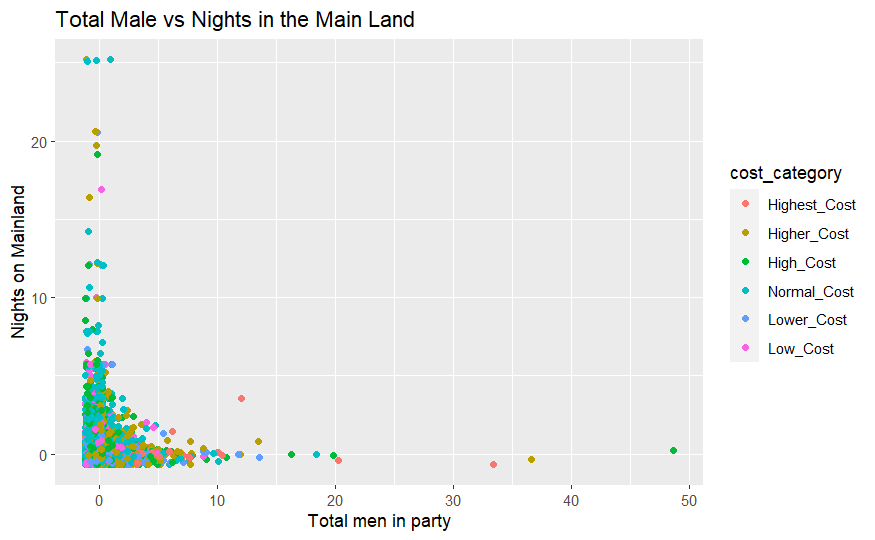
The number of people in party and how long they stay is related to cost but high spending tourists are here for a more limited time compared to research groups, volunteers, business tourists and large tour groups. Top spenders are smaller groups.
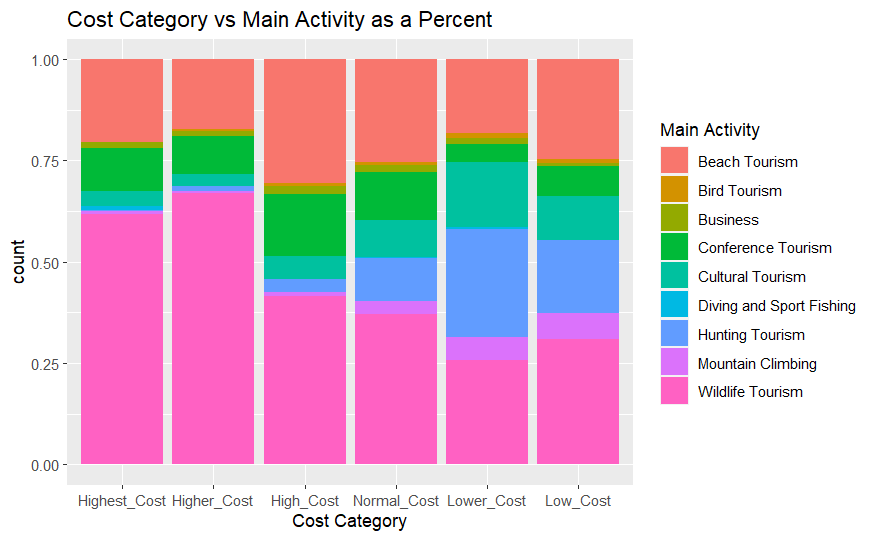
Wildlife tourism and beach tourism are the main draws for all consumers. The environment needs to be conserved for long term success. The previous strategy for the country was to increase number of travelers. Going forward they will need to focus on “whale” spenders.
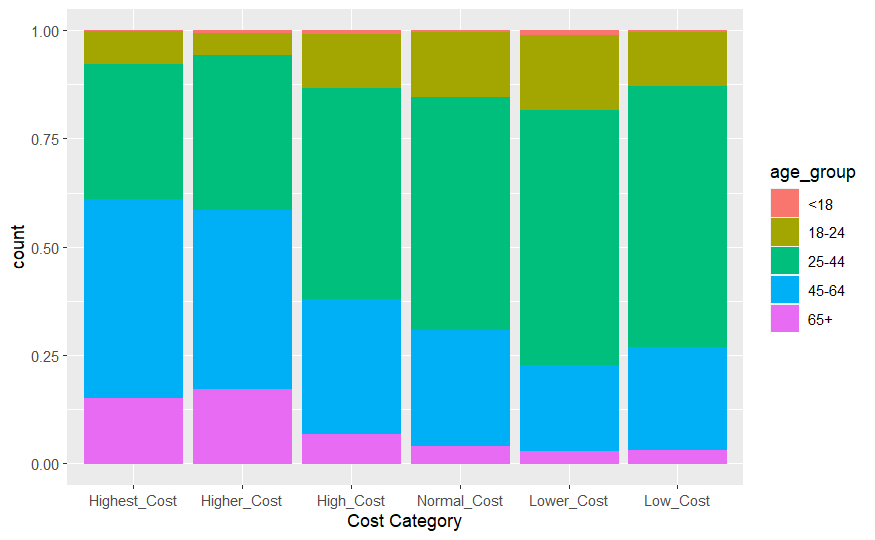
Targeted marketing understands the consumers, their wants and desires. Our high end spenders are older in age. They have more disposable income. They are planning to see the world and spend the money they have saved for a lifetime.
Machine Learning Models
I tested the supervised learning models of the Linear Discriminate Model and neural network. These were chosen since there was a known response variable we were testing for. I tested the models, focusing on the highest accuracy for classification. To improve accuracy, many of the models choose not to predict whether any travelers would be in the highest or lowest cost categories. Those two categories only make up 10% of the observations when added together. My focus was not only trying to accurately predict the category for spending but also predicting when travelers would be in the high-spending categories. The LDA was better at predicting the “higher cost”, and“highest-cost” categories compared to the neural network. Accuracy for 10-fold cross-validation using LDA was 51.6%. Random guessing would result in 16% accuracy
LDA uses the existing observations to predict future observations based on certain thresholds. LDA can be sensitive to outliers in the group. The data was split into a training group and a testing group. Two-thirds of the data was used for the training and one-third for testing. The training data was used with 10-fold cross-validation to build the model. This resampling of the data reduces the overfitting of the model. The LDA was then tested with double cross-validation, which proved to have a 51.7% accuracy compared to the neural network with 55% accuracy. The Neural Network achieved this by failing to place anyone in the top and bottom cost categories. LDA had placed tourists in all categories.
Neural Network
The neural network model uses layers of hidden neurons to weigh and predict which category to place a traveler in. I adjusted the size of the network and decay rate to optimal levels where the model still converged. The ideal size was 5 hidden nodes, producing a 19-5-1 model. The best decay rate was 0.5. The model with single-layer cross-validation achieved a similar accuracy level (54%) as LDA but did not place any travelers in the top or bottom price categories. I adjusted the neural network to focus on the kappa instead of accuracy. This allowed the model to predict the highest and lowest price categories. Kappa focuses on the observed vs the expected results. It tries to improve from the level of expected results. It expects 1/6 of the travelers to be in the highest cost category. This model has a lower accuracy at 43% overall but makes predictions for the highest price category we are most interested in.
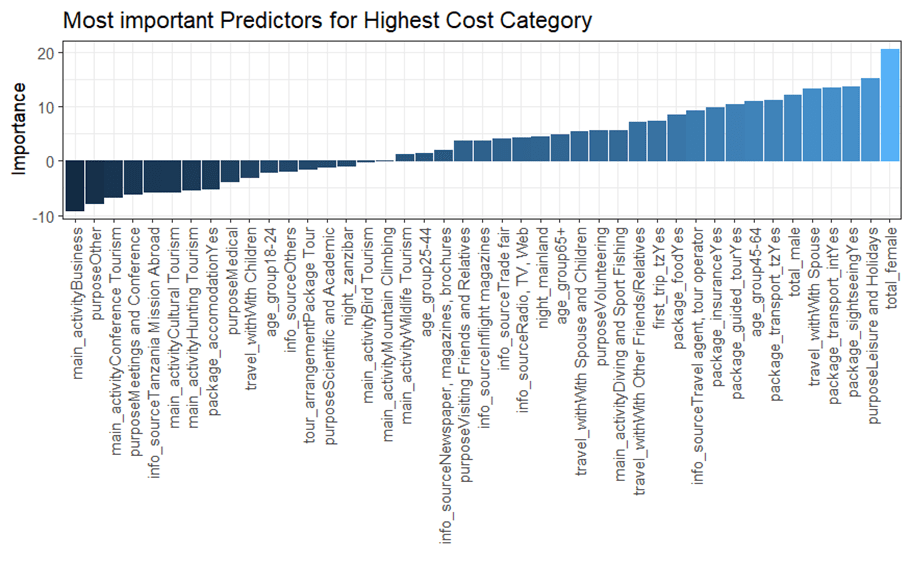
The top factors for prediction were travel purpose-leisure and whether the tour was part of a sightseeing package. The top factor was the number of women in the party, which makes sense since an increase in people leads to increased total costs. This was found using the olden plot. These were the most important factors for classifying the highest cost category. To maximize marketing, I recommend advertising trips to Tanzania in a package with accommodations for first-time travelers. This would include a larger group focusing on wildlife tourism and sport fishing. The package should be targeted to an older audience between the ages of 45 – 64.
Tourists that spend the least are business travelers. This makes sense since they are on a budget and have limited time. Mission trips and scientific trips also had a negative influence. They are the factors for lower-cost categories of tourism.
I also tested an unsupervised model, Apriori association rules, to see what factors strongly lead to high spending predictions. The model had many issues predicting high spending with high support over .05 and confidence over 0.5. There were no rules over the threshold for highest spending or higher spending. Unsupervised learning proved too unreliable to predict which factors lead to the highest spending accurately.
The modeling could be improved for the higher-priced categories by splitting the data and focusing on the more expensive ones. Another method would be regression, which is looking at the exact dollar value tourists will spend. The data set already had the tourists pre-classified into certain cost categories. If the dollar value was known, a model could be built focusing on how much tourists will spend and the dollar value those activities bring in. This could help the government of Tanzania and the tourist industry determine which activity might have a good return on investment. The model could show what value tourists place on certain activities. Bird Watching might add very little value to this model, but it might cost little to maintain and run. Overall, this current model would be better for marketing purposes and adds very little to what activities to invest in.
Conclusion
The best model was the LDA model. It had the highest accuracy overall and classified tourists into the Highest Cost category. This allows marketers to use targeted marketing on people likely to take a trip to Tanzania in the higher cost categories. The government can focus on this group in order to preserve the revenue stream coming in from tourism without the environmental destruction from over-tourism. The long-term stability of tourism requires a balanced approach, and machine learning models can help produce the optimal results if the goal is known.

Leave a comment