
Forecasting the Weather Impact on Corn Production with Machine Learning
Adam Gruber MS in Data Science- University of Wisconsin Green Bay, November 2025
Abstract
Corn is a foundational commodity in the modern economy, supporting food systems, fuel production, and numerous industrial applications. For businesses across the agricultural supply chain, accurately forecasting both corn yield and price is essential for managing costs, anticipating revenue, and reducing financial risk. This study evaluates the extent to which machine-learning models can predict corn yield and price in Iowa, Illinois, and Nebraska—three states that collectively produce approximately 40% of U.S. corn (United States Department of Agriculture, National Agricultural Statistics Service, n.d.). Using historical weather and production data from 1980 to 2019, a series of supervised learning models were developed to assess how effectively climate and economic variables forecast annual outcomes.
Among the yield models, linear approaches performed the best. The climate-only models revealed a clear inverse relationship between heat stress and yield, aligning with other known models. Overall, the final models explained roughly 30% of the variation in annual corn yield. In contrast, corn price proved far more predictable, with linear models accounting for approximately 82% of the variation in annual price levels. These results highlight the differing complexity of the two prediction tasks: yield is influenced by many factors not captured in climate summaries, while price responds more directly to broad economic signals.
- Background and Motivation
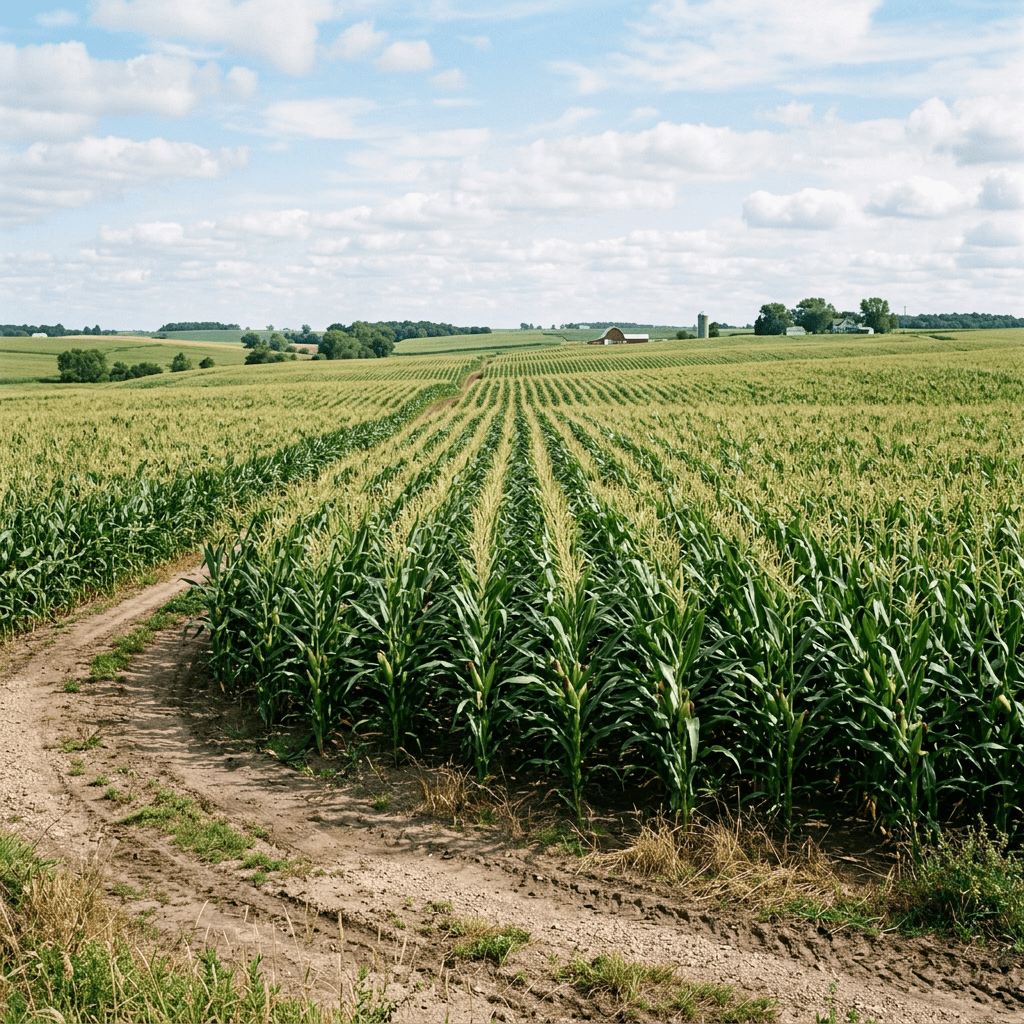
Corn is a major crop for the United States and the world. There are many different factors that affect the growth of corn from soil conditions, weather, fertilizer, and genetics. The weather is one of the most important factors, since corn is sensitive to extreme heat. A late spring, and cold summer can both negatively reduce the corn yield. A cold summer includes overnight lows below 50 degrees Fahrenheit (°F) and daytime temps below 70°F (Pioneer, n.d.). Anticipating the impact weather has on the yield can allow farmers and manufacturers to predict the upcoming shortages and plan for other sources, such as imports. Accurate predictions on yield can smooth prices and storage needs. Plans can be made in advance of harvest for additional transportation to move the grain to where it is needed. These insights can help to maximize net profit.
This project aims to use supervised learning to predict prices and yield across the three largest corn producing states. It combines: corn production statistics, district-level weather and economic data, climate features based on agricultural needs are created, and several supervised learning models are tuned. The goal was to predict corn yield with a MAE <15 bushels per acre. The goal for price was a MAE < 50 cents.
- Data
Data was collected from a variety of sources. Data for agricultural yield and prices were collected from the United States Department of Agriculture (USDA) National Agricultural Statistics Service for the states of Iowa, Illinois, and Nebraska from 1980-2019. This is a public source and clean data. The USDA breaks up each state into agricultural districts. Data for the annual yield was collected by districts. Price data was collected statewide by month.
The daily weather was provided by the National Oceanic and Atmospheric Administration (NOAA). There were 356,240 weather samples from the daily observations. They featured maximum temperature, minimum temperature, and precipitation. The weather was gathered from a NOAA weather station located in each agricultural district. Data was collected for the El Niño–Southern Oscillation (ENSO) weather cycle (National Oceanic and Atmospheric Administration Physical Sciences Laboratory, n.d.). It was encoded as a categorical variable based on the three phases: El Niño, La Niña, and Neutral.
- Feature and Label Selection
Each weather station recorded basic weather. The data was transformed to highlight the ideal weather for corn. The Purdue University(Nielsen, 2019) did a study highlighting the ideal growing temperature, which was the basis for the data transformation. Ideal daytime temperature is between 77 – 86°F. Growing Degree Days (GDD) were computed as the cumulative sum of ((TMAX + TMIN)/2 − 50°F) across the April–September growing season (North Dakota State University, North Dakota Agricultural Weather Network, n.d.). This measures the number of heat units across the season. Growth slows down below 50°F, according to the Nielsen at the University of Purdue.
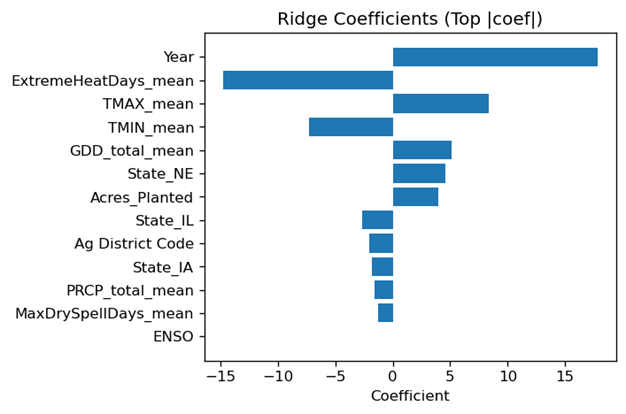
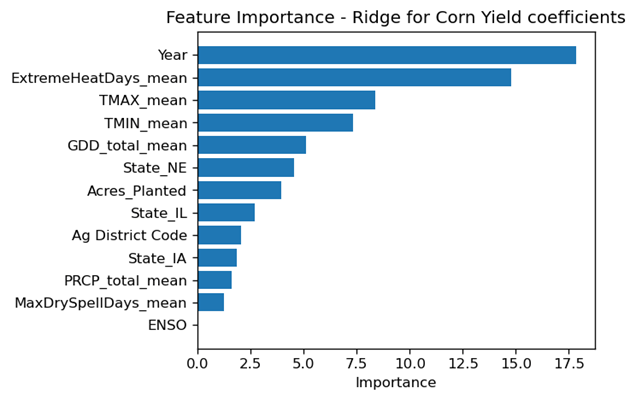
Temperatures above 95°Fcan be detrimental to corn yield(Nielsen, 2019). This can be seen in the coefficient chart below. The total number of days over 95°F was summed and used as a predictor for yield. Another engineered feature was the number of consecutive days without precipitation. This was called Max Dry Spell. District level aggregate features were computed based on the daily weather. The two target variables were defined for supervised learning. The target was the prediction of the annual corn yield of bushels per acre and the price per bushel (USD).
Price of soybeans was included as a predictor in the corn price model. This is because farmers can switch from one cash crop to another, depending on expected selling prices and the cost of inputs. Year is included as a predictor to capture the effect of changing technology from a variety of factors: genetics, improved farming techniques, and increased irrigation equipment use.
| Features | Description |
| GDD Total | Accumulated heat units |
| PRCP Total | Total annual precipitation |
| TMAX_mean | Average max |
| TMIN_mean | Average min |
| Extreme Heat Days | Days with Temperature > 95°F |
| Acres Planted | District Acres Planted |
| Max Dry Spell | Maximum consecutive dry days |
| ENSO Phase | El Niño, La Niña, Neutral |
| Year | Calendar Year |
| District Code | USDA Agricultural District Code |
- Model Selection
The primary goal was to provide the most accurate corn yield using supervised learning. Then utilize this data to predict the price per bushel of corn. Several different regression models were tested. 80% of the data was split for training and the remaining 20% for testing. Five-fold cross-validation was completed in order to add extra variation.
Linear regression was chosen for its interpretability. Ridge and Lasso regression were tested to assess the impact of penalizing large coefficients and reducing overfitting. They were implemented using five-fold cross-validation as well.
Tree algorithms were chosen due to their ability to capture nonlinear relationships. The price of corn, and the yield of corn, both have a linear relationship with the year. The weather can have a nonlinear impact on the yield of corn per acre, but in this case, linear models performed best. The price of soybeans per bushel was also used as predictor. It was implemented in the price model and in the yield per acre model. Price of soybeans was kept in the price of corn model, because of the integral nature of corn and soybeans. There is a risk of data leakage, but it is also reflective of economic signals. They share land inputs, uses, environmental factors and markets. Their prices often move together. Soybean prices reflect market reactions to nationwide and regional effects from tariffs to weather effects.
Price of soybeans was removed from the yield per acre of corn model, because the model was overfitting based on the price of soybeans per bushel. When the price of soybeans was included the model learned the indirect information of economic factors. Random Forest and XGBoost excelled when it was included and produced very high accuracy for yield predictions. It was only considered because farmers need to make the decision as to which group to grow. It was removed so the model would predict yield solely based on weather predictors.
| Yield Model | R^2 | RMSE | MAE |
| Linear Regression | 0.302385 | 24.96191 | 18.72309 |
| Ridge (best) | 0.302385 | 24.96192 | 18.7231 |
| Random Forest | -0.14437 | 31.97072 | 27.17684 |
| XGBoost | -0.00828 | 30.00957 | 25.08394 |
| Price Model | R^2 | MAE | RMSE |
| Linear Regression | 0.828844 | 0.421489 | 0.511635 |
| Ridge (best) | 0.82887 | 0.421794 | 0.511595 |
| Lasso | 0.801057 | 0.468823 | 0.551605 |
| Random Forest | 0.4769 | 0.754682 | 0.894451 |
- Results
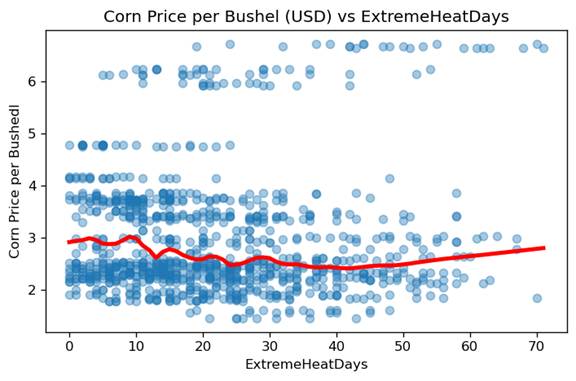
For yield prediction, the linear models proved to be the most effective. They were able to capture the relationship of weather predictors and yield better because they did less overfitting. Ridge regression was only able to explain 30% of the variance in the yield model. This can be see in the scatter plot below of the Corn Yield vs Extreme Heat Days. That was the most prominent factor besides the year. It had an absolute error of 18 bushels per acre. It had an RMSE of 25 bushels per acre. This is a very high level of uncertainty. For example, according to the Iowa Department of Agriculture and Land Stewardship (2024, March 14), Iowa produced 201 bushels per acre in 2023. Assuming it was an average yield, this would be over a 10% error rate. In reality that year was considered one of best years and the fourth highest yield per acre in Iowa (Iowa Department of Agriculture and Land Stewardship, 2024). The model failed to reach the goal of a MAE of <15 bushels per acre as planned.
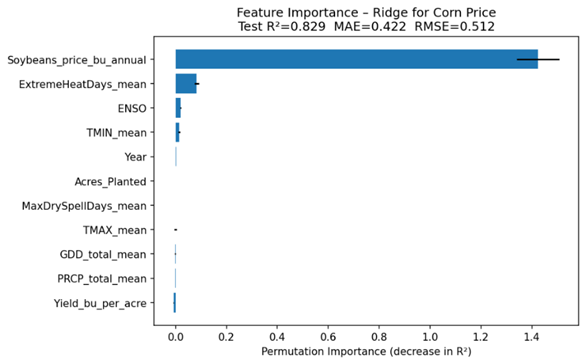
The best price model was ridge regression. It was able to explain 82% of the variance in the price of corn. It had an absolute error of 41 cents per bushel. The price model succeeded to achieve the target of MAE < 50 cents. The pricing model is more accurate at explaining the variation in the price per bushel of corn. It, too, had several opportunities to improve the model with additional data. The model for corn pricing relied heavily on the Price of Soybeans and Extreme Heat Days.
- Discussion
Results showed the ridge model was the best for predicting price and yield model. The price per bushel was best captured by linear models, such as ridge and linear. The best predictor of corn price was the soybean price. When the soybean price was removed, year was the next best predictor. This is related to several factors; the price of corn was similar to the price of soybeans, which is increasing over time due to general inflation and changing farming technology. That is why when the price of soybeans was removed, the year became the most important predictor of the price of corn. Ultimately, the price of soybeans was chosen to be kept in the model due to the real-world impact of external factors, aside from the weather, and corn yield.
The scatter plots below show the connections between corn prices and the two most important features for price prediction. These demonstrate pricing model struggles to predict price shocks to the system solely based on weather predictors.
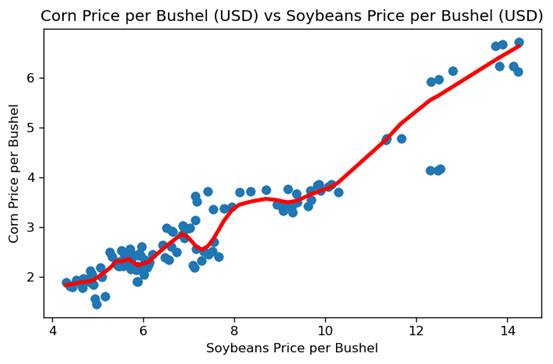
Weather impacts, such as a drought, will also affect the yield of corn. Prices of both soybeans and corn will move in tandem due to weather impacts. There are many external factors to price that were not captured. Corn and soybeans can be inputs for a variety of industries, such as the cattle industry, the fuel industry, and food production. There is also government intervention in the market. Government subsidies create a price floor, and imports can create a price ceiling (United States Department of Agriculture, Economic Research Service, 2019).
Results for the corn yield prediction showed the ridge model was the best. Feature importance showed the most important factors were extreme heat and the temperature. The states did not show as much of a difference in importance as expected. This is because the three states of Iowa, Illinois, and Nebraska are at similar latitudes. The XGBoost model struggled to adapt to the interactions and was overfitting.
There was clearly a disconnect between the weather and the corn yield as demonstrated by the Iowa Department of Agriculture and Land Stewardship,
“Despite 2023 ending as the state’s 22nd driest year on record, with 8 of the 12 months registering below normal precipitation and persistent drought continuing for a record 184 consecutive weeks and counting, Iowans once again produced a historically strong corn and soybean crop.”
They also cited 2023 as the fourth highest yield overall and on record, at an impressive 201 bushels per acre. This was despite a drought for eight months of the year. A more accurate model could account for other factors besides weather.
- Future Work
There are several different directions for future research. Seasonal aggregates were used to help predict the total annual corn yield for a district. This was done to capture the total number of ideal growing days. There are certain periods of the year that are more vital for corn to get precipitation, such as during the pollination phase (Nielsen, 2019). Drought at this point will reduce kernel size. An improved model would capture when the rain fell exactly. Comparing when the rain falls to what phase the corn is in essential to improving model accuracy according to Nielsen. This would require knowing the planting dates to know what phase corn is at that time of rainfall.
Additional agronomic factors could improve the yield model. Examples include: acres with irrigation equipment, fertilizer application rates, and the planting date are important to determine maximum potential yield. Soil types in each agricultural district are also needed to understand which districts are more affected by extreme heat or excess rain.
The price model’s accuracy could be improved in several different ways. The price model was based on weather predictors, corn yield and the price of soybeans, yet the government affects the price of corn directly and indirectly. This was not accounted for previously. Government offers direct subsidies to farmers and, subsidizing crop insurance. The government also controls imports and exports through tariffs, and import quotas. These economic levers used by the government greatly impact the prices. A more comprehensive model for price would also include other economic data, like the price of gasoline, and the price of ethanol.
Further research assessing for an inverse relationship between the price of corn and the price of beef is could be another economic factor that could model the price of corn. Corn is one of the main inputs for raising beef cattle. Cattle take longer to mature, and have a lag effect with the price of inputs rising compared to the price of beef rising. There could be a lead-lag effect with several different interlinked commodities, such as the beef prices. As one rises in price, the other may have complementary or inverse response. This may then lead to the initial item falling in price.
- Acknowledgements
Thank you to my parents for the years of working on the family Dairy farm. The knowledge gained about the crop science, economy and business have applied well to this project. Thank you to the USDA and NOAA for gathering and collecting data. I would also like to thank the teaching staff at UWGB for guidance.
Links to the data below and code
References
Iowa Department of Agriculture and Land Stewardship. (2024, March 14). Iowa remained production powerhouse in 2023. https://iowaagriculture.gov/news/IA-remained-prod-powerhouse
National Oceanic and Atmospheric Administration, National Centers for Environmental Information. (n.d.). NOAA National Centers for Environmental Information (NCEI) data access portal. https://www.ncei.noaa.gov/access
National Oceanic and Atmospheric Administration, Physical Sciences Laboratory. (n.d.). Historical El Niño and La Niña episodes based on the Oceanic Niño Index (ONI). https://psl.noaa.gov/enso/past_events.html
Nielsen, R. L. (2019). Corn growth and development. Purdue University Department of Agronomy. https://www.agry.purdue.edu/ext/corn/pubs/corn-07.htm
North Dakota State University, North Dakota Agricultural Weather Network. (n.d.). Corn growing degree days (GDD). https://ndawn.ndsu.nodak.edu/help-corn-growing-degree-days.html
Pioneer. (n.d.). Effects of high nighttime temperatures on corn. https://www.pioneer.com/us/agronomy/high-night-temperature-corn.html
United States Department of Agriculture, Economic Research Service. (2019). Economic drivers of U.S. corn production (Technical Bulletin No. 1878-02). https://ers.usda.gov/sites/default/files/_laserfiche/publications/47264/51088_tb1878b.pdf?v=48326
United States Department of Agriculture, National Agricultural Statistics Service. (n.d.). Corn production by state. https://www.nass.usda.gov/Charts_and_Maps/Field_Crops/cornprod.php
